
Opened 10 years ago
Closed 7 years ago
#2735 closed defect (fixed)
[ATLAS] Memory leak in Atlas actor view
| Reported by: | Stan | Owned by: | |
|---|---|---|---|
| Priority: | Must Have | Milestone: | Alpha 22 |
| Component: | Atlas editor | Keywords: | |
| Cc: | Patch: |
Description (last modified by )
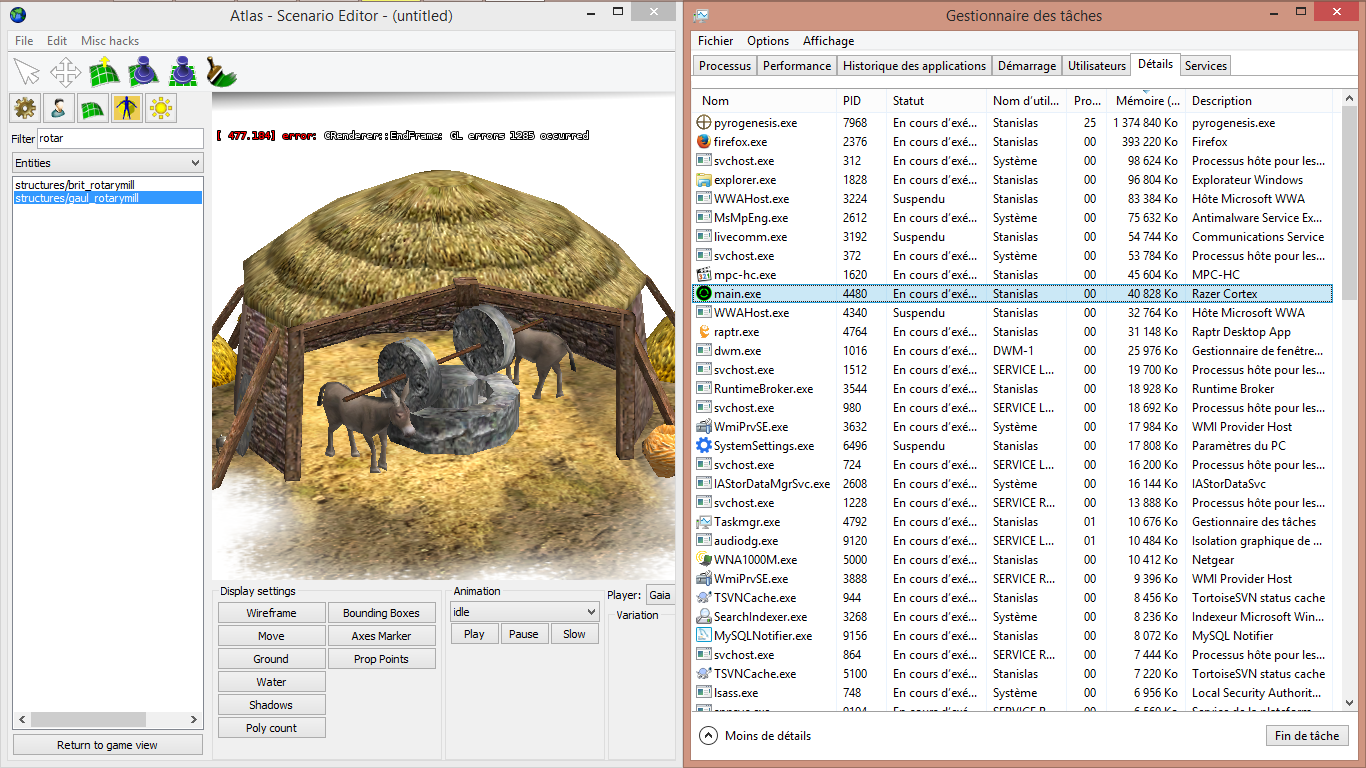
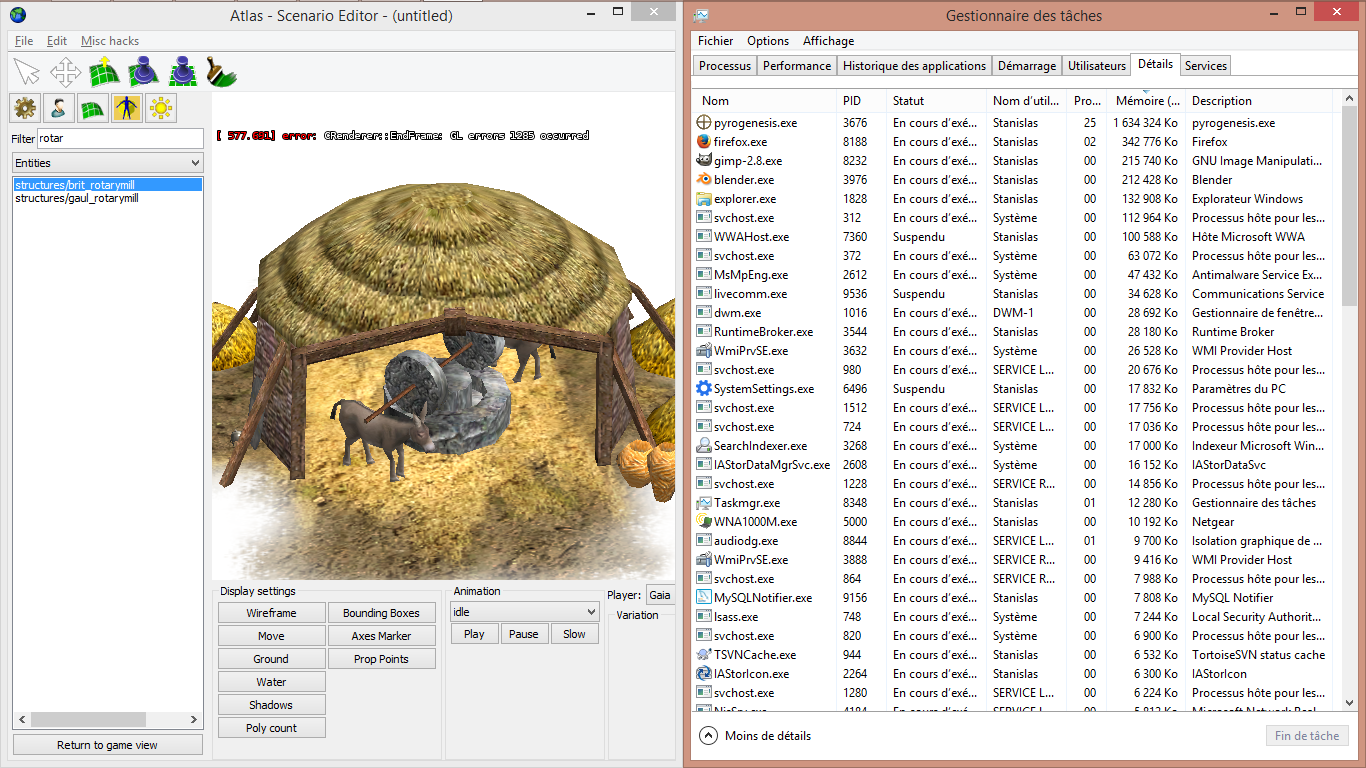
Steps to reproduce :
1.Open Atlas 2.Use the Rotary mill. 3.Click on play. 4.Wait till it crashes. (One or two minutes). Works if you run it on background.
- Monitor memory usage with task manager you'll see it can go up too 1.7GB and in this case crash.
Expected Output :
No more memory leak
What version of the product are you using? On what operating system? r15652
Attachments (3)
Change History (21)
comment:1 by , 10 years ago
| Milestone: | Backlog → Alpha 17 |
|---|
comment:2 by , 10 years ago
| Description: | modified (diff) |
|---|---|
| Priority: | Should Have → Must Have |
comment:3 by , 10 years ago
comment:4 by , 10 years ago
Nope just watching the donkey turn around again and again. For some reason it goes slowly to 395MB then Jump to 900 and after that goes until the 32 bits application let him go.
comment:6 by , 10 years ago
It was possible five days ago. I ´´il try again today. Do I need to compile ? :)
comment:7 by , 10 years ago
There has been an autobuild since r15787, but I expect there will be another today if you wanted to wait.
by , 10 years ago
| Attachment: | glerror.png added |
|---|
comment:8 by , 10 years ago
comment:9 by , 10 years ago
Indeed, the memory usage climbs steadily with the listed steps. It looks like roughly 1MB increase per 5 seconds. After maybe 5 minutes, it begins increasing at a much faster rate, 5-10 MB/s. Pausing the animation slows the memory increase.
Monitoring heap allocations with WinDbg (see this site), I noticed an increasing number of allocs of size 0xC4 bytes:
> !heap -stat -h 00d30000
 heap @ 00d30000
group-by: TOTSIZE max-display: 20
    size     #blocks     total     ( %) (percent of total busy bytes)
	64 b8054 - 47e20d0  (57.73)
    40 19d3a - 674e80  (5.19)
    c4 5bbd - 463cb4  (3.53)
    ffff0 4 - 3fffc0  (3.21)
    1c00 1e2 - 34b800  (2.65)
    78 5134 - 261060  (1.91)
    20 10837 - 2106e0  (1.66)
    50 620a - 1ea320  (1.54)
    59c3 40 - 1670c0  (1.13)
    30 7491 - 15db30  (1.10)
    60 38e5 - 1555e0  (1.07)
    10000 14 - 140000  (1.00)
    102000 1 - 102000  (0.81)
    100 fe6 - fe600  (0.80)
    18 9fd5 - efbf8  (0.75)
    1000 e3 - e3000  (0.71)
    80 1c45 - e2280  (0.71)
    74 1f17 - e166c  (0.71)
    40804 3 - c180c  (0.61)
    c17fc 1 - c17fc  (0.61)

...
> !heap -stat -h 00d30000
 heap @ 00d30000
group-by: TOTSIZE max-display: 20
    size     #blocks     total     ( %) (percent of total busy bytes)
    64 b8054 - 47e20d0  (35.99)
    c4 3c6c3 - 2e42d4c  (23.16)
    74 142ad - 923664  (4.57)
    40 22f12 - 8bc480  (4.37)
    18 5c047 - 8a06a8  (4.32)
    c a286d - 79e51c  (3.81)
    10 66359 - 663590  (3.20)
    ffff0 4 - 3fffc0  (2.00)
    1c00 1e2 - 34b800  (1.65)
    20 19a0c - 334180  (1.60)
    78 5134 - 261060  (1.19)
    50 620a - 1ea320  (0.96)
    4 65155 - 194554  (0.79)
    59c3 40 - 1670c0  (0.70)
    30 7491 - 15db30  (0.68)
    60 38e5 - 1555e0  (0.67)
    10000 14 - 140000  (0.63)
    102000 1 - 102000  (0.50)
    100 fe6 - fe600  (0.50)
    1000 e3 - e3000  (0.44)
Most of these are pyrogenesis!IModelDef::'vftable'
> !heap -flt s c4
with a call stack like this:
> !heap -p -a 2d66f178
    address 2d66f178 found in
    _HEAP @ d30000
      HEAP_ENTRY Size Prev Flags    UserPtr UserSize - state
        2d66f178 001c 0000  [00]   2d66f190    000c4 - (busy)
          pyrogenesis!IModelDef::`vftable'
        7735dff2 ntdll!RtlAllocateHeap+0x00000274
        6a690269 MSVCR100!malloc+0x0000004b
        6a69233b MSVCR100!operator new+0x0000001f
        14d1dfc pyrogenesis!InstancingModelRenderer::CreateModelData+0x000000cc
        14a2695 pyrogenesis!ShaderModelRenderer::Submit+0x00000075
        147407e pyrogenesis!CRenderer::SubmitNonRecursive+0x000000fe
        14b87e3 pyrogenesis!SceneCollector::SubmitRecursive+0x00000033
        13a0381 pyrogenesis!CCmpUnitRenderer::RenderSubmit+0x000001b1
        13a13f2 pyrogenesis!CCmpUnitRenderer::HandleMessage+0x00000032
        1380dd0 pyrogenesis!CComponentManager::BroadcastMessage+0x000000b0
        1375c62 pyrogenesis!CSimulation2::RenderSubmit+0x00000082
        151db0f pyrogenesis!ActorViewerImpl::EnumerateObjects+0x0000063f
        147660e pyrogenesis!CRenderer::RenderScene+0x0000006e
        151bd41 pyrogenesis!ActorViewer::Render+0x00000431
        151730a pyrogenesis!AtlasViewActor::Render+0x000000da
        1515bf6 pyrogenesis!RunEngine+0x00000516
        15921c9 pyrogenesis!thread_start+0x000000a9
        6a6dc556 MSVCR100!_endthreadex+0x0000003f
        6a6dc600 MSVCR100!_endthreadex+0x000000ce
        7616338a kernel32!BaseThreadInitThunk+0x0000000e
        77319f72 ntdll!__RtlUserThreadStart+0x00000070
        77319f45 ntdll!_RtlUserThreadStart+0x0000001b
comment:10 by , 10 years ago
Looking at the virtual memory space in VMMap, I see a lot of allocations of size 4100KB. So using the above technique in WinDbg, I filtered heap allocations in the range of 4000-4200 KB and found the following:
0:021> !heap -flt r 3D0900 401640
    _HEAP @ 530000
      HEAP_ENTRY Size Prev Flags    UserPtr UserSize - state
        31e00018 80000 0000  [00]   31e00030    3ffff0 - (busy VirtualAlloc)
        327f0018 80000 0000  [00]   327f0030    3ffff0 - (busy VirtualAlloc)
        33450018 80000 0000  [00]   33450030    3ffff0 - (busy VirtualAlloc)
        33040018 80000 0000  [00]   33040030    3ffff0 - (busy VirtualAlloc)
        33860018 80000 0000  [00]   33860030    3ffff0 - (busy VirtualAlloc)
        33c70018 80000 0000  [00]   33c70030    3ffff0 - (busy VirtualAlloc)
...
        53660018 80000 0000  [00]   53660030    3ffff0 - (busy VirtualAlloc)
        53a70018 80000 0000  [00]   53a70030    3ffff0 - (busy VirtualAlloc)
        540d0018 80000 0000  [00]   540d0030    3ffff0 - (busy VirtualAlloc)
all the same size, and the call stacks are like:
0:021> !heap -p -a 31e00018
    address 31e00018 found in
    _HEAP @ 530000
      HEAP_ENTRY Size Prev Flags    UserPtr UserSize - state
        31e00018 80000 0000  [00]   31e00030    3ffff0 - (busy VirtualAlloc)
        7735dff2 ntdll!RtlAllocateHeap+0x00000274
        18777279 atioglxx!DrvPresentBuffers+0x00f19ed9
        17f97d15 atioglxx!DrvPresentBuffers+0x0073a975
        17f99c9e atioglxx!DrvPresentBuffers+0x0073c8fe
        17f99bc7 atioglxx!DrvPresentBuffers+0x0073c827
        17fd2e69 atioglxx!DrvPresentBuffers+0x00775ac9
        17fd2c26 atioglxx!DrvPresentBuffers+0x00775886
        17f9b12e atioglxx!DrvPresentBuffers+0x0073dd8e
        17f9b36e atioglxx!DrvPresentBuffers+0x0073dfce
        17f9bc3a atioglxx!DrvPresentBuffers+0x0073e89a
        17f9b7ce atioglxx!DrvPresentBuffers+0x0073e42e
        17fd2587 atioglxx!DrvPresentBuffers+0x007751e7
        17fd295b atioglxx!DrvPresentBuffers+0x007755bb
        17fd363a atioglxx!DrvPresentBuffers+0x0077629a
        17fd38ec atioglxx!DrvPresentBuffers+0x0077654c
        17f98733 atioglxx!DrvPresentBuffers+0x0073b393
        17fb5ce5 atioglxx!DrvPresentBuffers+0x00758945
        17f800e1 atioglxx!DrvPresentBuffers+0x00722d41
        178a4bf3 atioglxx!DrvPresentBuffers+0x00047853
        14de4f2 pyrogenesis!CVertexBuffer::CVertexBuffer+0x000000f2
        14a6c29 pyrogenesis!CVertexBufferManager::Allocate+0x000000e9
        150aa5d pyrogenesis!VertexArray::Upload+0x0000004d
        14d1e21 pyrogenesis!InstancingModelRenderer::CreateModelData+0x000000f1
        14a2695 pyrogenesis!ShaderModelRenderer::Submit+0x00000075
        147407e pyrogenesis!CRenderer::SubmitNonRecursive+0x000000fe
        14b87e3 pyrogenesis!SceneCollector::SubmitRecursive+0x00000033
        13a0381 pyrogenesis!CCmpUnitRenderer::RenderSubmit+0x000001b1
        13a13f2 pyrogenesis!CCmpUnitRenderer::HandleMessage+0x00000032
        1380dd0 pyrogenesis!CComponentManager::BroadcastMessage+0x000000b0
        1375c62 pyrogenesis!CSimulation2::RenderSubmit+0x00000082
        151db0f pyrogenesis!ActorViewerImpl::EnumerateObjects+0x0000063f
        147660e pyrogenesis!CRenderer::RenderScene+0x0000006e
by , 10 years ago
| Attachment: | pyrogenesis-vmmap.7z added |
|---|
comment:11 by , 10 years ago
Do you know what could be the source of those allocations ? looks like a variable is inialized in a loop and the memory is not freed.
comment:12 by , 10 years ago
| Milestone: | Alpha 17 → Alpha 18 |
|---|
comment:13 by , 9 years ago
| Summary: | [ATLAS] OOM → [ATLAS] Memory leak in Atlas actor view |
|---|
comment:14 by , 9 years ago
| Component: | Core engine → Atlas editor |
|---|
comment:15 by , 9 years ago
| Milestone: | Alpha 18 → Alpha 19 |
|---|
comment:17 by , 9 years ago
| Milestone: | Alpha 19 → Backlog |
|---|
Backlogging due to nobody working on this at present and it's not a release blocker.
comment:18 by , 7 years ago
| Milestone: | Backlog → Alpha 22 |
|---|---|
| Resolution: | → fixed |
| Status: | new → closed |
Fixed in r19346.
Tested this on Windows 7, using r15776
Have had the game running for quite a while with the simulation running, memory usage sometimes goes up, sometimes down. But not to that extreme. And most of the time I'd say the memory usage over all has gone down rather than up. Or now that I double-check it the result is that first it goes up to ca 320.000 kb, then it fluctuates around that number after that.
Are you doing something else game-related at the same time Stan? Like editing an XML file that the game then is trying to hotload or something? Not sure whether that would have anything to do with this type of bug, but just trying to guess at something :P