
Opened 9 years ago
Closed 7 years ago
#3403 closed enhancement (fixed)
[PATCH] Show graphs in the summary screen
| Reported by: | elexis | Owned by: | Vladislav Belov |
|---|---|---|---|
| Priority: | Should Have | Milestone: | Alpha 22 |
| Component: | UI & Simulation | Keywords: | patch |
| Cc: | Patch: |
Description (last modified by )
Concept
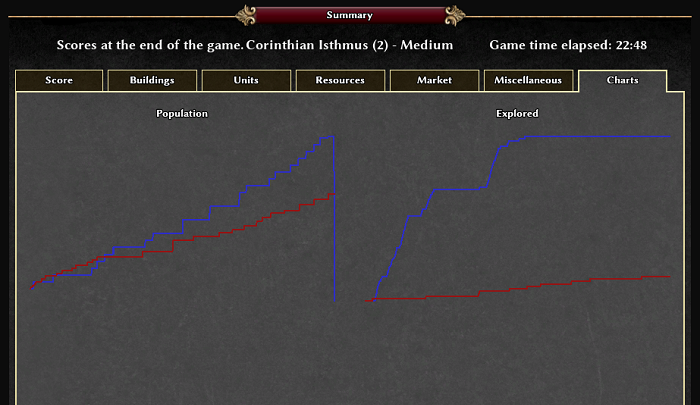
We should have some charts in the summary screen, so that the advancement of the game can be understood. The particular score should be plotted on the Y-axis with time on the X-axis. We should show the same categories that we already display for the end of the game.
Implementation
Saving stats over time:
As seen in leaveGame() in session.js, we would only need to capture Engine.GuiInterfaceCall("GetExtendedSimulationState").players every N minutes and pass it to the summary screen. It currently contains the following data per player:
{
    "unitsTrained": {
        "Infantry": 0,
        "Worker": 0,
        "Female": 0,
        "Cavalry": 0,
        "Champion": 0,
        "Hero": 0,
        "Ship": 0,
        "Trader": 0,
        "total": 0
    },
    "unitsLost": {
        "Infantry": 0,
        "Worker": 0,
        "Female": 0,
        "Cavalry": 0,
        "Champion": 0,
        "Hero": 0,
        "Ship": 0,
        "Trader": 0,
        "total": 0
    },
    "unitsLostValue": 0,
    "enemyUnitsKilled": {
        "Infantry": 0,
        "Worker": 0,
        "Female": 0,
        "Cavalry": 0,
        "Champion": 0,
        "Hero": 0,
        "Ship": 0,
        "Trader": 0,
        "total": 0
    },
    "enemyUnitsKilledValue": 0,
    "buildingsConstructed": {
        "House": 0,
        "Economic": 0,
        "Outpost": 0,
        "Military": 0,
        "Fortress": 0,
        "CivCentre": 0,
        "Wonder": 0,
        "total": 0
    },
    "buildingsLost": {
        "House": 0,
        "Economic": 0,
        "Outpost": 0,
        "Military": 0,
        "Fortress": 0,
        "CivCentre": 0,
        "Wonder": 0,
        "total": 0
    },
    "buildingsLostValue": 0,
    "enemyBuildingsDestroyed": {
        "House": 0,
        "Economic": 0,
        "Outpost": 0,
        "Military": 0,
        "Fortress": 0,
        "CivCentre": 0,
        "Wonder": 0,
        "total": 0
    },
    "enemyBuildingsDestroyedValue": 0,
    "resourcesGathered": {
        "food": 0,
        "wood": 0,
        "metal": 0,
        "stone": 0,
        "vegetarianFood": 0
    },
    "resourcesUsed": {
        "food": 0,
        "wood": 0,
        "metal": 0,
        "stone": 0
    },
    "resourcesSold": {
        "food": 0,
        "wood": 0,
        "metal": 0,
        "stone": 0
    },
    "resourcesBought": {
        "food": 0,
        "wood": 0,
        "metal": 0,
        "stone": 0
    },
    "tributesSent": 0,
    "tributesReceived": 0,
    "tradeIncome": 0,
    "treasuresCollected": 0,
    "lootCollected": 0,
    "percentMapExplored": 16,
    "teamPercentMapExplored": 16,
    "percentMapControlled": 12,
    "teamPercentMapControlled": 12,
    "peakPercentMapControlled": 0,
    "teamPeakPercentMapControlled": 0
}
This takes about 10kb space for 8 players. So saving a state every minute would cost roughly 1MB memory every 2 hours. In case #3258 will be implemented, it should save those states using zip compression, reducing the file size by maybe 90%. Displaying the charts: We could have a checkbox somewhere (for example besides the button) to toggle between charts and numbers. This way you can switch between tabs and correlate the graphs of the different tabs.
Attachments (12)
Change History (60)
comment:1 by , 9 years ago
comment:2 by , 9 years ago
I've taken the liberty of forking and updating the charts-mod elexis mentioned so it now works with the current SVN state. The updated mod may be acquired from https://github.com/0ADMods/summary-charts.
It would be nice to have a better way of doing the GUI stuff however, and perhaps some thought could be given as to specifics after A19 ships.
comment:3 by , 9 years ago
| Keywords: | patch review added |
|---|---|
| Owner: | set to |
| Status: | new → assigned |
| Summary: | Show graphs in the summary screen → [PATCH] Show graphs in the summary screen |
The following patch was made by AgentX and modified by s0600204 to be compatible, I just made the patch. Note that you will probably have to copy the png files as the patch don't support binary well.
by , 9 years ago
| Attachment: | 3403.patch added |
|---|
comment:4 by , 9 years ago
| Owner: | removed |
|---|---|
| Status: | assigned → new |
comment:5 by , 9 years ago
| Milestone: | Backlog → Alpha 20 |
|---|
Interested.
The c++ GUI part might become somewhat tedious.
comment:6 by , 8 years ago
| Keywords: | review removed |
|---|---|
| Milestone: | Alpha 20 → Backlog |
Given that the original mod isn't under any specified license and the modifications do not change that (how could they), this cannot be included as it is.
Also unless there is some work on having the actual graph drawing done in C++ (or at least not by using a hack on top of the gui repeat code) this is unlikely to be included.
comment:8 by , 8 years ago
AgentX is going to put it under the M.I.T. License.
About the hack he replied that's how he was told to do it on the forums when he started it.
comment:9 by , 8 years ago
| Description: | modified (diff) |
|---|---|
| Priority: | Nice to Have → Should Have |
comment:11 by , 8 years ago
Adding a players population percentage time line like in AOE ll would be very cool and usefull - including the icons for the 3 phases & Battle events
https://numb3r5s.files.wordpress.com/2015/11/aoe-timeline-1.jpg
comment:12 by , 7 years ago
I think better to create GUI element than this hack, native will be faster and could be used ingame. I will test it soon.
comment:13 by , 7 years ago
I have created native CChart, it works really fast for me. I will upload a patch soon.
by , 7 years ago
| Attachment: | charts.png added |
|---|

comment:16 by , 7 years ago
| Keywords: | rfc added |
|---|---|
| Milestone: | Backlog → Work In Progress |
| Owner: | set to |
| Status: | new → assigned |
comment:18 by , 7 years ago
Replying to Imarok:
Nice ;) What about adding labeled coordinate axes?
Yeah, but firstly we should release this version, because better to split adding the fundamental element and adding the small feature. And axes have a simple implementation enough.
comment:20 by , 7 years ago
typo: StatisticsTracker.prototype.updateSequneces = function(data)
Regarding Chart, code is OK, but names need some change imo, by using actual graph terminology. Replace "item(s)" with "series(s)", eg CChartItem to CChartSeries, and in that struct change CStr m_Id to CStr m_Label or something.
The JS properties also need work: what's a "list color"? Is the color of the series? "table_x" should really be "x_values" and so on.
Generally speaking instead of using a "table", you should pass series objects with just Y values and an axis (first axis or second axis, so that we support 2 axes), and pass x-axis/y-axis.
comment:21 by , 7 years ago
As we discussed with @wraitii (http://irclogs.wildfiregames.com/2016-12-03-QuakeNet-%230ad-dev.log 15:00+) the chart will draw lines and points, and a more complex chart should be derived from the original. So no need to create the more abstract class Table.
comment:22 by , 7 years ago
| Keywords: | review added; rfc removed |
|---|
I like the current implementation with those modifications. Ideally CGuiSeries would be a little more flexible but I'm not entirely sure that's possible. Pushing to review for another look but imo this is good.
follow-up: 24 comment:23 by , 7 years ago
I think the c++ is good, but: -you have an error in the JS if you open the summary in-game. -the actual JS GUI needs more work before we can commit it.
comment:24 by , 7 years ago
Replying to wraitii:
I think the c++ is good, but: -you have an error in the JS if you open the summary in-game. -the actual JS GUI needs more work before we can commit it.
- I will check the first one, it was able to see on a map which was started before the patch.
- Which work do you mean?
follow-up: 26 comment:25 by , 7 years ago
There should be some kind of axis, and the title is not obvious enough. There should also probably be a border around the graph itself.
comment:26 by , 7 years ago
Replying to wraitii:
There should be some kind of axis, and the title is not obvious enough. There should also probably be a border around the graph itself.
I think it's easy to add border (just style) or axes. And the patch isn't small enough, and as I suggested above:
Yeah, but firstly we should release this version, because better to split adding the fundamental element and adding the small feature. And axes have a simple implementation enough.
follow-ups: 28 30 comment:27 by , 7 years ago
Imho there should be a graph for (nearly) every summary counter. You could e.g. display the graph, when you click on the corresponding value.
Also nothing speaks against committing the c++ Chart part and the js summary graph part separately.
comment:28 by , 7 years ago
Replying to Imarok:
Also nothing speaks against committing the c++ Chart part and the js summary graph part separately.
It would be good to commit the patch separately.
comment:30 by , 7 years ago
Replying to Imarok:
Imho there should be a graph for (nearly) every summary counter. You could e.g. display the graph, when you click on the corresponding value.
How it should looks like? Like a replacing values by charts?
follow-up: 32 comment:31 by , 7 years ago
../../../source/gui/CChart.cpp: In member function ‘virtual void CChart::HandleMessage(SGUIMessage&)’:
../../../source/gui/CChart.cpp:38:41: warning: unused parameter ‘Message’ [-Wunused-parameter]
 void CChart::HandleMessage(SGUIMessage& Message)
                                         ^~~~~~~
Use UNUSED.
Also something else broken in some other part of the code that someone else noticed.
comment:32 by , 7 years ago
Replying to elexis:
Use
UNUSED.
It will be used soon.
Also something else broken in some other part of the code that someone else noticed.
What do you mean?
follow-up: 34 comment:33 by , 7 years ago
Me in some internal forum topic, now with a few typo fixes:
... [ r19027 ] contains implicit casts in code that does memory accesses, which is something that is very commonly seen in code that is vulnerable to OOB reads and writes. By now I'm quite certain that this piece of code only fails in a way that doesn't leak any data, just yield some unexpected results if the C++ data would be changed from the C++ side, or via another path not yet there. I did however need 4 reads of that code to come to that assertion, for pieces of code that should be a lot shorter (about 1 line for reading and 1 for writing). Using To/FromJSVal might even work out of the box, otherwise extending them slightly would be a lot shorter than those blocks of code (and would not duplicate something we already do in a common place). The code also seems to copy around vectors for fun.
comment:34 by , 7 years ago
Replying to leper:
... [ r19027 ] contains implicit casts in code that does memory accesses, which is something that is very commonly seen in code that is vulnerable to OOB reads and writes. By now I'm quite certain that this piece of code only fails in a way that doesn't leak any data, just yield some unexpected results if the C++ data would be changed from the C++ side, or via another path not yet there. I did however need 4 reads of that code to come to that assertion, for pieces of code that should be a lot shorter (about 1 line for reading and 1 for writing). Using To/FromJSVal might even work out of the box, otherwise extending them slightly would be a lot shorter than those blocks of code (and would not duplicate something we already do in a common place). The code also seems to copy around vectors for fun.
I know about leftBottom = rightTop = m_Series[0].m_Points[0];, but it needs a shortest check that all series are empty, i.e. std::find_if, but I'm not sure yet.
Do you mean to use To/FromJSVal for GUIST_CGUISeries, GUIST_CGUIList, etc insead of the current way? But it seems it won't be really shorter.
comment:35 by , 7 years ago
@leper: after reviewing the current implementation, and getting really annoyed at C++ template compilation, see attached patch for the best solution I could come up with. Does that fix your issues?
by , 7 years ago
| Attachment: | charts_fix.patch added |
|---|
comment:36 by , 7 years ago
Ah, I see the issue (which is actually looping forever) is actually present in the common conversion code, so we did end up finding a bug.
When does for (u32 i = 0; i < val.size(); ++i) with val of type std::vector loop forever? Asserting that this case doesn't happen would be nice.
The WARN_IF_NOT macro shouldn't be in the new header, it isn't needed there, and only in one of the files that include it (the one were it was initially). Headers leaking macros is bad, so if it would have been used in there and is not one of the things it is explicitly exporting, then it should have been #undefed.
VECTOR is quite generic and could possibly conflict with another macro (possibly from another header), so changing the name to more explicitly state what it is used for would be nice. The old name was fine as long as it was only used in a single cpp file as the scope was clear there.
Not all includes in the new header are needed, and thus shouldn't be in there.
Never remove #include "precompiled.h" as the first include. This only leads to pain down the road and we spent quite some time figuring out why we had seemingly random crashes when those were missing in a few files after the i18n import.
The CVector2D conversion should be in the GuiConversion.cpp file, adjust includes accordingly.
Tests (for conversion, including roundtrips) for the new conversions would be nice, but we are lacking those for GUI script conversions. I plan on adding some given that existence of those would have saved me quite some time when looking for an issue during the SM upgrade.
Apart from that both look a lot better, the vector copying noted above is still valid. (Mostly not a review, ask someone who is actually active.)
by , 7 years ago
| Attachment: | 3403_statistic_tracker_proposal.patch added |
|---|
Here is a proposal on how to save the progression of all summary values. based on patch by vladislavbelov. Probably fixing the tests is needed.
by , 7 years ago
| Attachment: | 3403_statistic_tracker_proposal_v2.patch added |
|---|
Remove unneeded declaration of sequences
comment:37 by , 7 years ago
On irc on 2016-12-18 days ago:
21:17 < elexis> the constant seems to be in global scope, but the name is very generic, so it might with some bad luck collide with some other update sequence interval from some other thing
21:18 < elexis> and the constant is only relevant to the statistics tracker, so it should become part of the component
21:19 < elexis> then the PushValue function seems too general as it doesn't work with the components data itself, but only the given arguments
21:19 < elexis> it sounds better to have 2 PushValue functions, one that works for objects, one that works for the other case
21:20 < elexis> so we can avoid the object checks
21:20 < elexis> L520 and L521 can be merged
21:22 < elexis> isnt it sufficient to pass only strings and an array or object of x/y pairs for PushValue instead of using recursion?

21:25 < elexis> but we only need to track x/y pairs and some identifier string, right?
21:25 < Vladislav> yep
21:25 < elexis> so the function should become strict to only allow that kind of input
21:25 < Vladislav> PushValue just convert object of values to object of arrays
21:26 < Vladislav> It allows object with different depth
21:27 < elexis> but do we need that?
21:28 < elexis> we dont even need to pass the X value, since it will be the current time
21:28 < elexis> so I'm expecting calls like cmpStatisticsTracker.PushValue("resources_wood", 1234);
by , 7 years ago
| Attachment: | 3403_summary_graphs_v0.2.patch added |
|---|
Here is a proposal on how to generically display all values shown in the summary
comment:39 by , 7 years ago
(I know the code isn't that clean, but its just a proposal to show the underlying mechanism)
Atm it just can show the values displayed without formatting in the summary .
Though if the proposal is accepted, I'll make it possible to display charts for all values.
A picture from a 15 min AI game:

follow-ups: 41 43 comment:40 by , 7 years ago
Here are the missing things on the cpp side: Bugs:
- A graph with only constant 0s doesn't draw anything (probably wrong scaling)
Additional features: Should have:
- Axes and axes description with scale
- A way todisplay the name of each series (e.g. red = Imarok, blue = Player2)
- there should be some kind of frame or border to differentiate the graph area from the rest
Really nice to have:
- different line types (continous, dotted, dashed)
- the possibility to add a markers at specific points(phase reached, death, etc.). So a function to display an image at a specific coordinate
comment:41 by , 7 years ago
Replying to Imarok:
- there should be some kind of frame or border to differentiate the graph area from the rest
A background color settable form js could be enough
comment:42 by , 7 years ago
Another thing: the cpp part should proper display a chart when some values are Infinity
comment:43 by , 7 years ago
Replying to Imarok:
Here are the missing things on the cpp side: Bugs:
- A graph with only constant 0s doesn't draw anything (probably wrong scaling)
This bug appears with every constant value.
comment:44 by , 7 years ago
Note to self: there were some comments to my proposal in http://irclogs.wildfiregames.com/2017-02-07-QuakeNet-%230ad-dev.log from 15:53
comment:45 by , 7 years ago
| Keywords: | review removed |
|---|
js part of summary graphs now at https://code.wildfiregames.com/D144.
comment:46 by , 7 years ago
| Description: | modified (diff) |
|---|---|
| Milestone: | Work In Progress → Alpha 22 |
comment:48 by , 7 years ago
| Resolution: | → fixed |
|---|---|
| Status: | assigned → closed |
Thanks for the great patch, we've been waiting years for this feature :-) Please create new tickets for further enhancements.
There has been a charts mod out there, see: http://wildfiregames.com/forum/index.php?showtopic=18763&page=2 (version 17 & 18) https://github.com/agentx-cgn/Mod-Chart (version 17)
But it has some flaws: