
#5422 closed defect (needsinfo)
Selecting an unit has a big performance impact.
| Reported by: | theotherhiveking | Owned by: | |
|---|---|---|---|
| Priority: | Should Have | Milestone: | |
| Component: | UI & Simulation | Keywords: | |
| Cc: | Vladislav Belov | Patch: |
Description (last modified by )
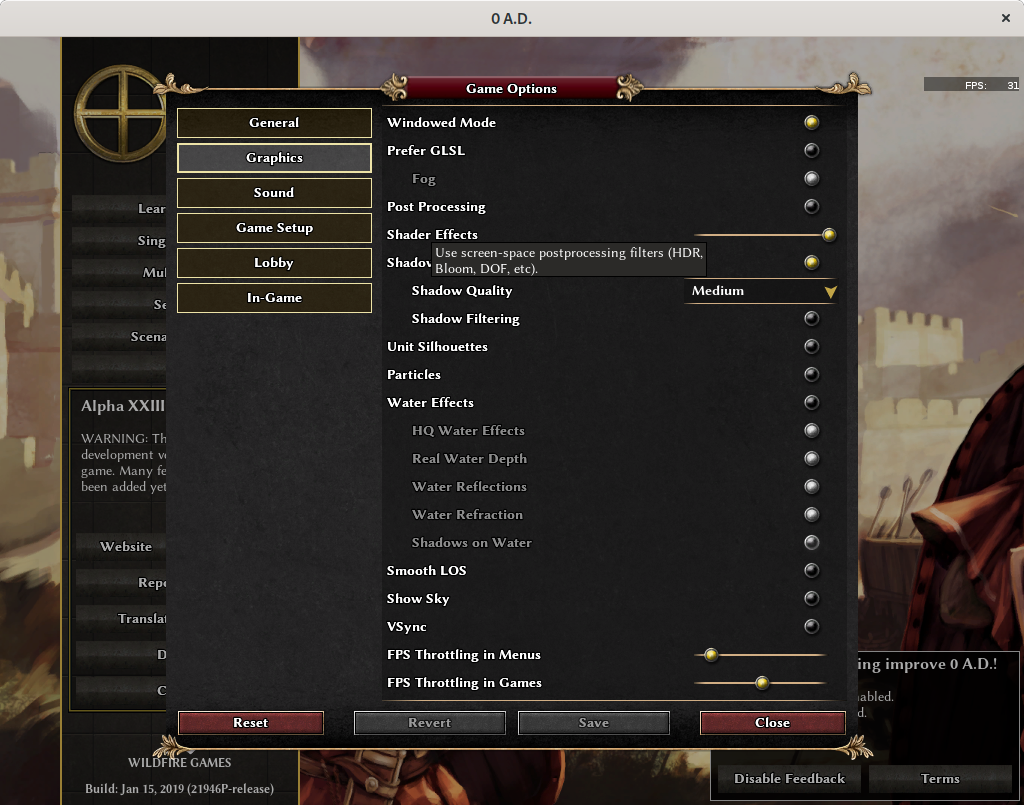
Version tested: January's Ken Wood. Installed with the Archlinux package manager.
The system_info and hwdetect files are attached.
I did the following test: -Loaded the map Bactria (2) -Set my civ to Persians -Removed the AI player so it was just me in the game.
Nothing selected profile: Do nothing for about 5 seconds, then take the snapshot and exit the game.
TC Selected profile: Do nothing for about 5 seconds, then select the TC, take the snapshot and exit the game.
Soldier selected profile: Do nothing for about 5 seconds, then select a shield bearer, take the snapshot and exit the game.
I renamed the profile.txt file between tests so the results would end up in different files.
Attachments (9)
Change History (27)
by , 5 years ago
| Attachment: | settings.png added |
|---|
by , 5 years ago
| Attachment: | nothing_selected.txt added |
|---|
by , 5 years ago
| Attachment: | soldier_selected.txt added |
|---|
by , 5 years ago
| Attachment: | tc_selected.txt added |
|---|
by , 5 years ago
| Attachment: | system_info.txt added |
|---|
by , 5 years ago
| Attachment: | userreport_hwdetect.txt added |
|---|
comment:1 by , 5 years ago
| Description: | modified (diff) |
|---|
comment:2 by , 5 years ago
| Milestone: | Backlog |
|---|---|
| Resolution: | → needsinfo |
| Status: | new → closed |
comment:3 by , 5 years ago
Ah, there is more information in IRC 2019-04-02-QuakeNet-%230ad-dev.log
19:40 < theotherhivekin> The profiler says that both the 'gui' and render take longer, I think it's related to the number of buttons visible in the GUI.
19:41 < vladislavbelov[> Is the framerate slower even if you do nothing (no mouse moves, keyboard presses)?
19:44 < theotherhivekin> Btw, I'm talking about 55fps avg with nothing selected to 43ish with a soldier selected.
So the question is whether the camera perspective was changed (different number of polygons rendered?) Whether range auras were rendered.
It's not only the tooltips that are updated, but also all the unit actions.
They are updated once per simulation turn. That is all 100ms in singleplayer and all 500ms in multiplayer.
In multiplayer, you can also press F9 and type Engine.SetTurnLength(...), this way you can see whether it's the reoccuring update or not.
Also consider that FPS is average.
So it can be 50FPS with no selection, but if something is selected, it may render nothing for some milliseconds and then continue at 50 FPS, resulting in an average of 40, although it always renders at the same speed when it renders.
comment:4 by , 5 years ago
Sorry. By performance I meant milliseconds per frame. The attached profiler snapshots contain both milliseconds per frame and milliseconds per turn, but both seem affected equally, probably because of the averaging as you said.
So for example, the nothing_selected snapshots says that render->gui->unlogged takes 5.5ms per frame, but after selecting a soldier it takes about 8.5ms.
Dispatch events -> GUI event handler -> handle event in native GUI -> unlogged is also about 1.5ms slower.
In every test I did nothing other that selecting the unit. So no camera movement or ordering units around, just moving the mouse and left clicking the unit. I also removed the AI player and completely exited the game between tests.
I will try SetTurnLength too and attach the results.
I will try to run Profiler2 too.
comment:5 by , 5 years ago
nothing_selected snapshots says that render->gui->unlogged takes 5.5ms per frame after selecting a soldier it takes about 8.5ms
There is a hotkey to hide the GUI, alt+g or something, wiki:HotKeys It might be that it's the bottom panel with all the buttons.
If it's rendering and measured per frame, then the once-per-turn events shouldn't matter, unless that number is also averaged.
One can also prove that it's not GetEntityState by varying the number of selected units and seeing that this number is independent of the number of units. (GetEntityState cost are proportional to the number of selected units)
If it's not GetEntityState, we should reopen this.
If its renderer -> gui -> unlogged, it should be identified, logged, and fixed afterwards.
by , 5 years ago
| Attachment: | soldier_selected_no_gui.txt added |
|---|
comment:6 by , 5 years ago
I think GetEntiyState falls under 'gui sim update'. I did some tests and thats the one that slows down the most with each aditional selected unit.
I disabled the GUI, and that did bring all the lost performance back and then some.
render->gui->unlogged performance so far:
-Soldier selected, gui enabled: 8.5ms
-TC selected, gui enabled: 5.160ms
-Nothing selected, gui enabled: 2.5ms
-Anything (or nothing) selected, gui disabled: 0.25ms
I attached the new snapshot.
comment:7 by , 5 years ago
| Cc: | added |
|---|
render->gui->unlogged must be the JS in the GUI pages defined in public/gui/, right?
One can comment out function calls to find the bad ones. OnSimulationUpdate or similar in session/*.js would be one entry point. As mentioned Engine.SetTurnLength in multiplayer mode will change how long turns take = how often that function is called.
Other than that there are only timers events (for example chat) and hotkey/input events (input.js).
Dunno if I forgot something, there's many thousands of lines of JS, in session/.
One can also use let start = Engine.GetMicroseconds(); ... warn(Engine.GetMicroseconds() - start); to measure the time a certain statement consumes.
comment:8 by , 5 years ago
I tried setting the turn length to both very high (2000+) and very low values (20).
Long turn lengths didn't really do much to speed up renderer -> gui -> unlogged. It was 0.3ms faster at most.
The very short turn lengths did slow it down somewhat. From 8.5ms with the shield bearer selected to about 9.5ms
comment:9 by , 5 years ago
So the reported performance impact is independent of turn-dependent event processing.
I disabled the GUI, and that did bring all the lost performance back and then some.
So it sounds like it's the rendering of the GUI objects, possibly the buttons that's slow.
You already suspected that it's the number of buttons per unit. That could be tested by selecting a unit that can't build/train anything (mauryan worker elephant, fishing ship) and selecting a unit that can build/train a lot (citizen soldier).
In case you want to dig into the source, you can download it within 15min or so. You don't have to compile it, as logn as you don't change C++ code. wiki:BuildInstructions
One can trigger a lot of GUI code also using the JS console (F9):
Here the main "ingame" gui code file: https://trac.wildfiregames.com/browser/ps/trunk/binaries/data/mods/public/gui/session/session.js
And for the bottom panel: https://trac.wildfiregames.com/browser/ps/trunk/binaries/data/mods/public/gui/session/selection_panels.js
One should be able to hide the entire bottom panel using a JS console command. If I read the GUI objects in https://trac.wildfiregames.com/browser/ps/trunk/binaries/data/mods/public/gui/session/session.xml correctly:
Engine.GetGUIObjectByName("selectionDetailsPanel").hidden = true;
Same for "selectionDetailsPanel", "unitCommands" are the other panel names.
(Might have been wrong to suspect that renderer->gui includes JS. One could look at the C++ source what it actually contains.)
comment:10 by , 5 years ago
New comments at:
http://irclogs.wildfiregames.com/2019-04/2019-04-05-QuakeNet-%230ad-dev.log
So it is GetEntityState after all?
Notice the result of that is cached, and the cache is cleared once per turn (session.js IIRC).
Until one or two years ago it was split into two functions, so that one didn't have to pull all data once a unit is selected. But that turned out to make it even slower, since both functions were called most of the time.
(If it is GetGUIObjectByName, a cache could be added in C++ or JS. If it's added to C++ we would add a comment clarifying that we won't implement renames of GUIObjects.)
comment:11 by , 5 years ago
I'm still not quite sure what's going on. I don't believe it is GetEntityState, as the longer turn lengths don't seem to help.
So far my (quite crude, I'm using warn and not the tracelogger) measurements so far indicate that the slowests functions are both in gui/session/selection_panels.js:
-g_SelectionPanels.Construction.setupButton
-g_SelectionPanels.Training.setupButton
What these two function have in common is that they both contain a lot of getFOOTooltip calls (gui/common/tooltip.js).
The setupButton functions get called by updateUnitCommands in gui/session/unit_commands.js.
updateUnitCommands looks at the selected units to determine what buttons to show, so the number of selected units plays a role, just a rather small one.
updateUnitCommands is run by updateSelectionDetails in gui/session/selection_details.js
updateSelectionDetails in run by updateGUIObjects in gui/session/session.js
updateGUIObjects gets called by onTick but only if g_Selection.dirty is true. A comment claims onTick is run every frame.
updateGUIObjects gets also run by onSimulationUpdate() no matter what.
I'm trying to test if g_Selection.dirty if causing it run run more than once per turn, even when the selection hasn't changed.
comment:12 by , 5 years ago
g_Selection.dirty wasn't the source of the problem. updateGUIObjects was running only once per turn, so that wasn't the problem either.
However, thanks to those tests I noticed that disabling the UI wasn't making those functions go any faster. I initially thought that after disabling the UI they wouldn't get called at all, and that that was the source of the speedup, but that wasn't the case.
comment:13 by , 5 years ago
Calming.
If render->gui->unlogged contains the source of the performance impact, then we should find out what exactly is covered by that.
Looking at your txt file, I see gui tick exists, so if anything in the onTick function is slow, I expect it woudl be found in that row.
It really sounds like it's the actual rendering itself that is slow and that it for example depends on the number of textures drawn.
Since you had no trouble going through JS, I would recommend to not be afraid to look at the C++ code either. It should be possible to locate the code that contributes to render->gui->unlogged. One can do a keyword search for PROFILE in source/gui/ and source/renderer/.
CGUIManager::Draw() in GUIManager.cpp for example contains PROFILE3_GPU("gui"); which sounds like it could be one place contributing to the unlogged part.
If you say that hiding the GUI doesn't change the performance, then it might be that it's either not the rendering itself, or that there is still renderer code being called if the objects are hidden. Deleting them would rule out the latter. But probably more efficient to try to locate before grasping at straws.
comment:14 by , 5 years ago
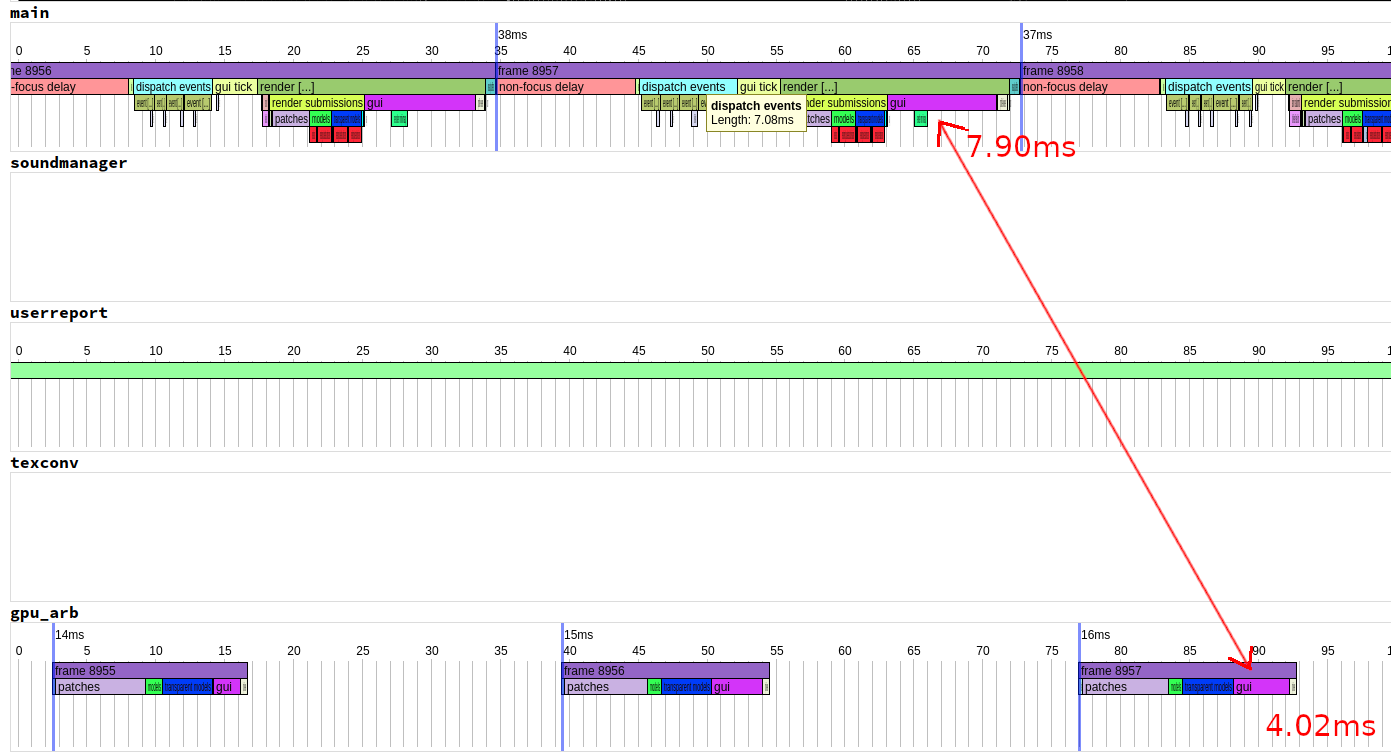
I'm not quite sure the rendering itself is slow. Profiler2 claims that the gui only takes about 3-4ms under the 'gpu_arb' section. But takes ~8ms in the main thread. I'm not quite sure I'm interpreting the output correctly. See the attached image.
So far, I have noticed that the slowdown seems to be independent of the game resolution, I also set the gui scaling to very low and very high values, that didn't affect performance either
I realized that I could very easily add aditional buttons to the gui to test their performance impact by just adding some units to the training queue. So far each button seems to take close to 0.1ms
Maybe Callgrind will have the answer.
If you say that hiding the GUI doesn't change the performance, then it might be that it's either not the rendering itself, or that there is still renderer code being called if the objects are hidden.
I meant the performance of the JS functions doesnt change. Disabling the UI greatly improves performance. It's just that at first I thought it was faster because the JS code wasn't run if the GUI was disabled. So the problem might be in C++ land.
by , 5 years ago
| Attachment: | Profiler2.png added |
|---|
comment:15 by , 5 years ago
Disabling the UI greatly improves performance. So far each button seems to take close to 0.1ms
Vladislav mentioned that switching textures costs significant performance, so one could see if using the same texture for all buttons would cut the measured slice significantly.
But it's probably better to not look at random suspicion, but to work with the hard facts deductively; i.e. find the C++ function that adds the "unlogged" part (it's only one?), then cut this into multiple slices, thus eventually locating the greatest bottleneck.
I think it's just adding one more PROFILE call in the cpp file, and compiling only one file should be very quick (after finishing the first clean build).
With regards to your screenshot, I think the first graph (main thread) speaks about all the time spent in the GUI (possibly including JS? probably including everything source/gui/) whereas the gpu_arb sounds a lot like being the rendering part exclusively (source/renderer/?).
by , 5 years ago
comment:16 by , 5 years ago
It's the Draw function GUI components have, but I haven't had the time to actually look at the code yet,
I attached an SVG file with the profiler results. You can hover over the rows to get more detailed info and click them to zoom in. It's pretty nifty.
The preview trac generates isn't interactive, so you have to click 'Download Original' at the bottom and open the downloaded file in your browser for a more detailed view.
comment:17 by , 5 years ago
If you say hiding the GUI removes the bottleneck and that it's the Draw method, then one can test which of the few GUI Objects in session.xml are the slowest ones.
I have the suspicion it's just too many of them, or too many different textures.
https://trac.wildfiregames.com/browser/ps/trunk/binaries/data/mods/public/gui/session/session.xml
Engine.GetGUIObjectByName("selectionDetailsPanel").hidden = true;
Same for "selectionDetailsPanel", "unitCommands" are the other panel names.
comment:18 by , 5 years ago
It seems a long time is spent binding and unbinding textures. It might be a driver issue. Still researching.
Selecting entities has a significant impact, because the program pulls all the data from the componens of the selection to assemble the tooltip. Also it can show things like aura or attack range visualization.
It's GetEntityState in GUIInterface.js, last time someone worked on it was in #4322, but it's still slow since it still pulls in much data.
The more entities one selects, the worse it gets.
So the question is whether there is something other than GetEntityState being relevant for the performance difference.
While you did mention what you did to measure the results and attached the files, you didn't post which of the values are the ones you refer to.
Depending on how much the performance difference is, we may be able to conclude whether it's "only" GetEntityState.
I'm marking the ticket as "Needs Info", but we can reopen it immediately as soon as we have information that show that this is so much of a performance impact that GetEntityState couldn't possibly have caused it.