
| Version 1 (modified by , 13 years ago) ( diff ) |
|---|
Profiling
This page aims to give an overview of the various tools available for profiling the game (i.e. measuring speed and resource usage), and some details on how to use them.
In-game profiler
When the game is running, press F11 once to display the profiler. This is hierarchical: some rows have a digit to their left, and pressing the corresponding key will drill down into that row and show timings for the sub-sections within that. (Press 0 to go back up a level). Rows in white are from C++, rows in red are from scripts. Only code running on the main thread is counted.
The columns are:
- calls/frame - number of times that section has been entered in a single frame (averaged over the past 30 frames). A frame corresponds to a single iteration of the main game loop, usually clamped to a maximum 60fps by vsync.
- msec/frame - total amount of time spent inside that section per frame (summed for all calls; averaged over the past 30 frames).
- mallocs/frame - number of memory allocations inside that section per frame. Only works when the game is compiled in debug mode - in release mode it's always 0. Might not work on Windows at all.
- calls/turn - number of times called in a single simulation turn (not averaged). A simulation turn occurs typically every 200ms or 500ms or so, and runs all of the gameplay update code, and corresponds to a variable number of frames, so this is more useful than calls/frame for measuring code that only gets called during the simulation turn.
- msec/frame - same idea.
- mallocs/frame - same idea again.
To use this profiler in code, do:
#include "ps/Profile.h"
then
{
  PROFILE("section name");
  ... code to measure ...
}
and it will measure all code from the PROFILE until the end of the current scope. (You can also use PROFILE_START("foo"); ... PROFILE_END("foo"); which automatically add scoping braces.)
Pressing F11 multiple times will toggle through different profiler modes (script data, network data, renderer data).
Pressing Shift+F11 will save profile.txt somewhere (usually the binaries/system/ directory, assuming you're running code from SVN). Pressing it multiple times (without restarting the game) will append new measurements to that file.
Attachments (4)
-
profile_24_1.gif
(80.2 KB
) - added by 11 years ago.
example profile graph
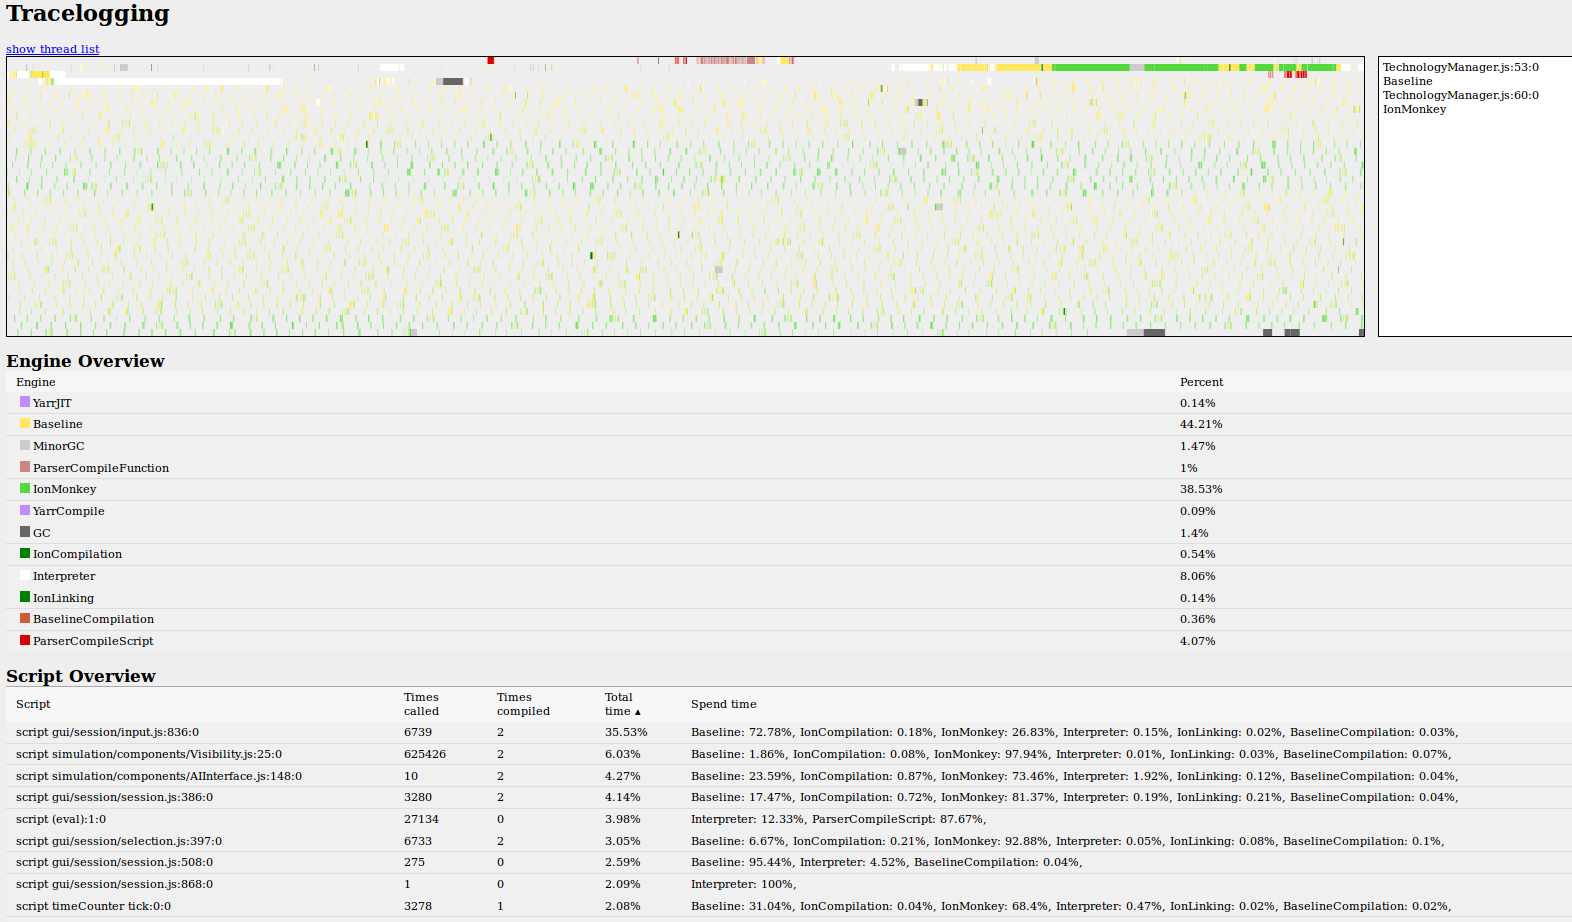
- tracelogger.png (177.1 KB ) - added by 9 years ago.
-
filter_data.diff
(722 bytes
) - added by 6 years ago.
"Changes to filter the output of extract.pl"
-
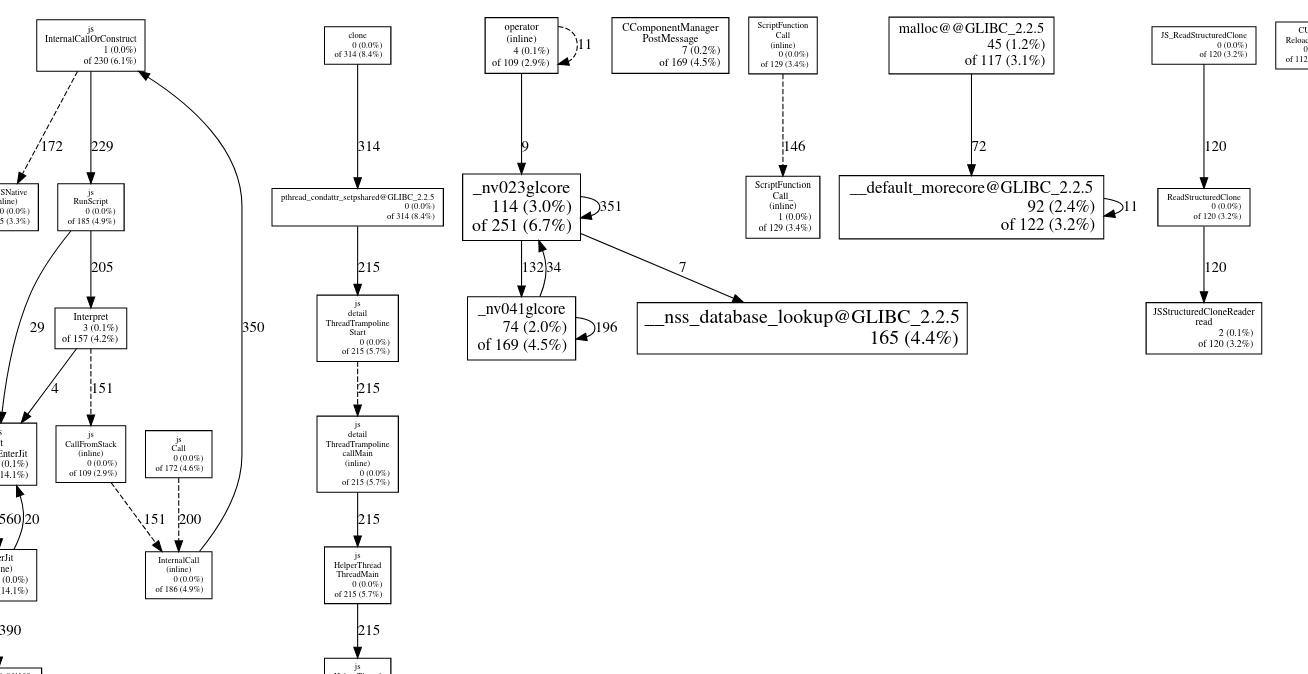
0ad_pprof_example.png
(113.8 KB
) - added by 21 months ago.
pprof (gperftools) output example
Download all attachments as: .zip