
Table of Contents
Profiling
This page aims to give an overview of the various tools available for profiling the game (i.e. measuring speed and resource usage), and some details on how to use them.
In-game profiler
When the game is running, press F11 once to display the profiler. This is hierarchical: some rows have a digit to their left, and pressing the corresponding key will drill down into that row and show timings for the sub-sections within that. (Press 0 to go back up a level). Rows in white are from C++, rows in red are from scripts. Only code running on the main thread is counted.
The columns are:
- calls/frame - number of times that section has been entered in a single frame (averaged over the past 30 frames). A frame corresponds to a single iteration of the main game loop, usually clamped to a maximum 60fps by vsync.
- msec/frame - total amount of time spent inside that section per frame (summed for all calls; averaged over the past 30 frames).
- mallocs/frame - number of memory allocations inside that section per frame. Only works when the game is compiled in debug mode - in release mode it's always 0. Might not work on Windows at all.
- calls/turn - number of times called in a single simulation turn (not averaged). A simulation turn occurs typically every 200ms or 500ms or so, and runs all of the gameplay update code, and corresponds to a variable number of frames, so this is more useful than calls/frame for measuring code that only gets called during the simulation turn.
- msec/turn - same idea.
- mallocs/turn - same idea again.
To use this profiler in code, do:
#include "ps/Profile.h"
then
{
  PROFILE("section name");
  ... code to measure ...
}
and it will measure all code from the PROFILE until the end of the current scope. (You can also use PROFILE_START("foo"); ... PROFILE_END("foo"); which automatically add scoping braces.)
The profiler is relatively expensive; you usually shouldn't put PROFILE in code that will be called thousands of times per frame, since the profiling overhead will dominate the code you're trying to measure.
Pressing F11 multiple times will toggle through different profiler modes (script data, network data, renderer data).
Pressing Shift+F11 will save profile.txt in the game's logs folder (see GameDataPaths). Pressing it multiple times (without restarting the game) will append new measurements to that file.
Profiler2
The in-game profiler is designed to show average performance data at an instant in time. While this is adequate for some purposes, it's not as good for analyzing rapid fluctuations in game performance. It also doesn't support multiple threads, so only the engine thread can be analyzed. To solve these shortcomings, profiler2 was created.
Profiler2 collects profiling data across multiple threads and runs a small web server in the engine. When enabled, an HTML page and script can request, analyze and render this profiling data. Profiler2 is currently enabled by pressing Ctrl+F11 while the game is open, similar to the in-game profiler. Then the HTML page included with the profiler2 tool (source/tools/profiler2/profiler2.html) is opened in a web browser supporting HTML5.
Profiler supports the PROFILE2, PROFILE2_IFSPIKE, PROFILE2_AGGREGATED macros. There is also PROFILE2_EVENT to record events in profiler2 and PROFILE2_ATTR to add printf-style strings to the current region or event (seen in tooltips when hovering the profiler2 rendered output). This allows displaying more contextual data than would typically be possible in a profiler. For convenience, using PROFILE3 will measure with both the in-game profiler and the new profiler2.
For more detailed GPU profiling data on some systems, PROFILE2_GPU and PROFILE3_GPU can be used similarly.
Additional information on Profiler2 such as screenshots and explanations of the HTML interface can be found at Profiler2
Low-overhead timer
A less fancy way to measure sections of code is:
#include "lib/timer.h"
...
{
  TIMER(L"description");
  ... code to measure ...
}
which will record the time from TIMER until the end of the current scope, then immediately print it via debug_printf (which goes to stdout on Unix, and the debugger Output window on Windows).
To measure cumulative time spent in a section of code:
#include "lib/timer.h"
TIMER_ADD_CLIENT(tc_SomeDescription);
...
{
  TIMER_ACCRUE(tc_SomeDescription);
  ... code to measure ...
}
which will sum the time spent, then print it via debug_printf once when the game is shutting down. The output will be like
TIMER TOTALS (9 clients)
-----------------------------------------------------
  tc_SomeDescription: 10.265 Mc (12x)
  ...
saying the cumulative time, measured in CPU cycles (kc = kilocycles (103), Mc = megacycles (106), etc). (It measures cycles since that's cheaper and more reliable than converting to seconds, given that clock frequency can change while the game is running. Divide by your CPU frequency manually to get real time). This should have significantly lower overhead than PROFILE, so you can use it in functions that get called more often.
Simulation replay mode
If you're not measuring graphics or GUI code, replay mode lets you run the simulation (the gameplay code and scripts and the AI etc) at maximum speed with all graphics disabled. This should be fully deterministic (i.e. you'll get the same results on each run) and doesn't need user interaction (so you can easily run in Valgrind). It even allows you to create nice graphs for comparing the performance before and after your changes!
First, play the game normally, in either single-player or multiplayer. It will save a replayfile replays/${DATE}_${INDEX}/commands.txt (see GameDataPaths) based on the current date. This contains the map setup data and a list of all players' inputs, so the game can be replayed. You might want to copy the commands.txt to somewhere memorable.
Run the game like
./pyrogenesis -mod=mod -mod=public -replay=path/to/commands.txt
(or something equivalent on Windows). It will print its status to stdout (or the Output window on Windows). It gives the MD5 checksum of the complete simulation state once it's finished, which is handy if you're changing the code and want to make sure you're not affecting the simulation behaviour. Run in a profiler to measure whatever you want to measure.
Creating graphs
This is also referred to as Profiler1.
The replay mode also stores the in-game profiler state in profile.txt every 20 turns. There's a script in source/tools/replayprofile/ which can plot a graph from that file.
- Check source/tools/replayprofile/extract.pl if it points to the right profile.txt (you can also change it to point to another working copy, but remember not to accidentally commit this change later)
- Optionally apply the attached patch and define a filter for some of the events (again, don't commit your changes!)
- Run perl extract.pl > data.json
- Optionally make a second measurement for your modified code using the same commands.txt and extracting the data to data_1.json
- Optionally copy and paste lines from data_1.json to data.json and give them a sensible name (of course you can paste as many lines from as many other data files as you want)
- Open graph.html
It will look similar to this:

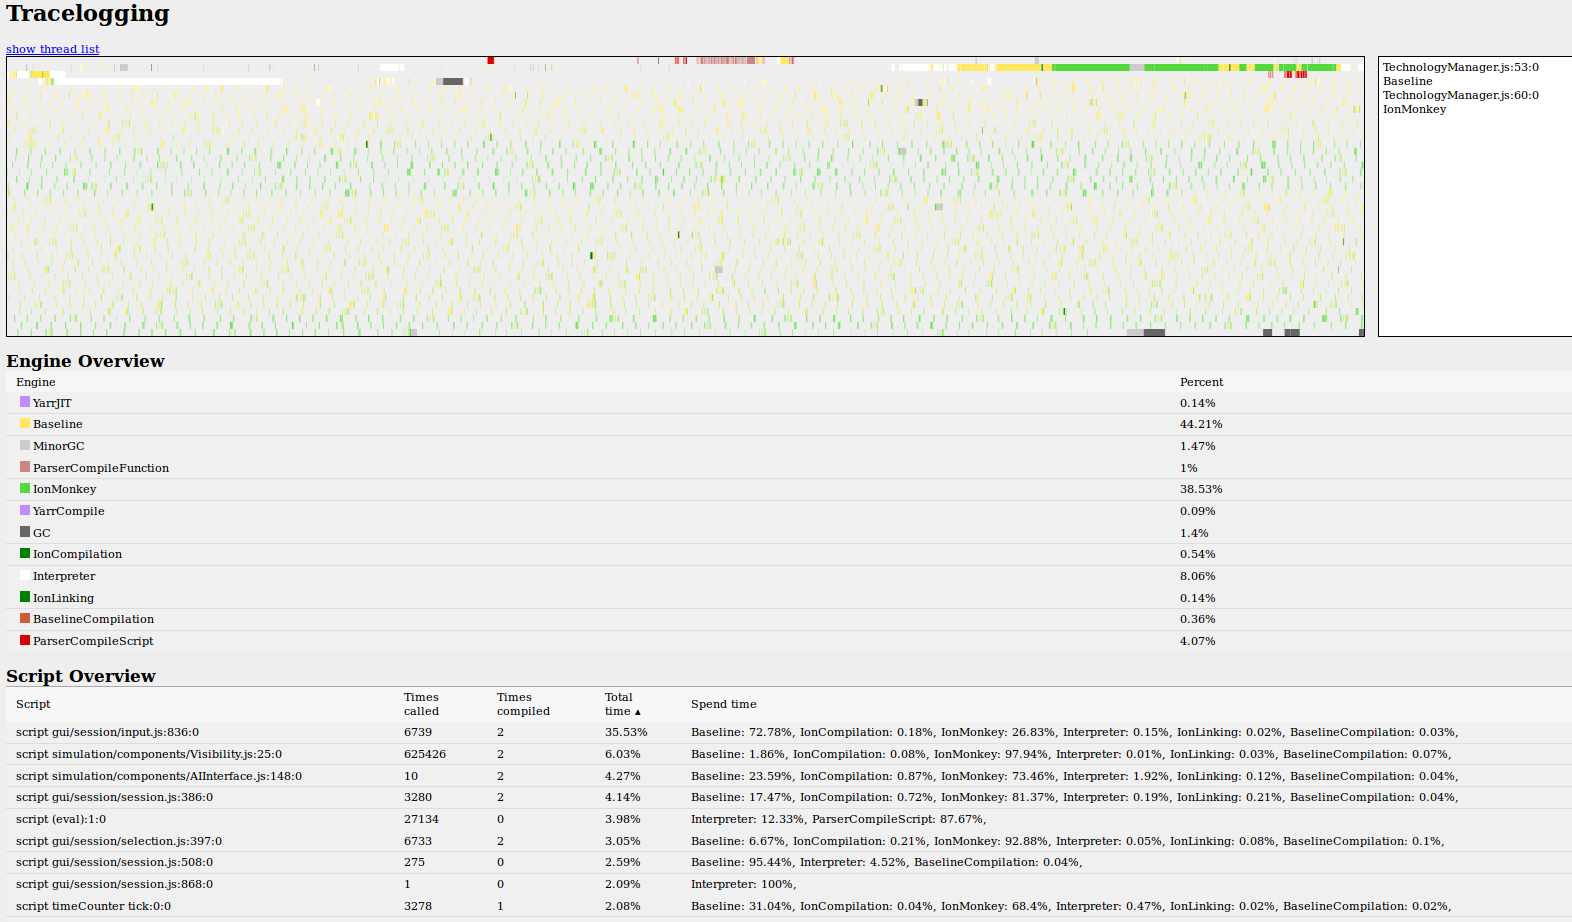
SpiderMonkey Tracelogger
SpiderMonkey, the JavaScript engine we are using, has some own performance profiling capabilities for analyzing JS performance.

Characteristics
Compared to the other profiling tools and approaches, the Tracelogger has the following characteristics:
- Shows in which optimization mode the JS code runs (Interpreter, Baseline, Ion Monkey). This is the only profiler listed here that shows this information. Functions which run in Interpreter or Baseline mode too much could be a performance issue (also read the part below about inlining).
- Shows how many times functions got compiled by SpiderMonkey.
- Shows how many times functions got called in total (also read the part below about inlining).
- Shows total runtime percentages for each function (also read the part below about C++ functions).
- There is a small overhead, but it's small enough that you can still play games as normal. The overhead is mainly caused by flushing profiling data to the disk. It reduces performance by around 5%, and you see on the output where the flushing happens, so it's not a big problem.
- The Tracelogger only profiles JavaScript functions (also read the part below about C++ functions).
- Getting profile data from longer games can require quite a lot of harddisk space (around 10-15 GB).
- Larger profile data has to be reduced before it can be viewed. This can take quite a while (up to an hour).
Inlining
You have to be a bit careful with your conclusions because SpiderMonkey sometimes inlines functions. If you get much lower numbers of calls for a function than you would expect, then it could be because the function got inlined in a parent function. In this case only the calls of the parent function are counted. Also take a look at the number of calls if you see that a function runs in Baseline mode most of the time. Very low numbers of calls are an indication that it probably got inlined. In this case it's normal that it runs in Baseline most of the time before inlining happens.
C++ functions
C++ functions on a C++ only callstack are not shown and ignored in the runtime percentages you see. Time spent from C++ functions which are called from JS functions is included, but not measured separately (these functions count towards the JS function that calls them).
Using the Tracelogger
When you use it the first time, you can just do all the steps described below in order.
Enabling tracelogging
This is done through environment variables. You can use the script located at ps/trunk/source/tools/tracelogger/tracelogger_options.sh to load default options.
Note: Windows versions seem to have inconsistencies with respect to the use of semicolons to delimitate values.
Getting the Tracelogger
The tool to view Tracelogging data is not included in SpiderMonkey or bundled with 0 A.D.. You can get it from git:
git clone https://github.com/h4writer/tracelogger tracelogger
Version with git hash 1c67e97e794b5039d0cae95f72ea0c76e4aa4696 was successfully tested with our version of SpiderMonkey (in case future versions aren't compatible anymore).
Measuring
When SpiderMonkey is built with Tracelogging enabled, all you need to do is building the game and running the test.
Reducing and viewing data
Data can become quite large (several GB). You could view this data directly in the browser, but it would take forever to load and you usually want to reduce the data before viewing it.
Use the reduce.py file from the git checkout. Pypy is a lot faster than python, but some versions of pypy have a bug. You can try with pypy, but if the output files are only 24 bytes, then you are affected by the bug and should probably use python instead. The output path points to a directory and contains a prefix to use for the reduced files ("reduced" in this example).
pypy tools_v2/reduce.py /path/to/tracelogging/data/tl-data.json /path/to/output/reduced
To view the data, copy server.py from the website directory to /path/to/output/. Start the script so the data gets fed automatically to the tracelogging tool, then open tracelogger.html in a browser and select the desired file. Finally, select a thread from the list.
Profiling with google-perf or pprof
On debian-based systems, gperftools is packaged under google-perftools. For graphical output you also need to install graphviz.
sudo apt-get install google-perftools graphviz
On arch-based systems, the package is called gperftools.
To start profiling, run:
LD_PRELOAD=/usr/lib/libprofiler.so CPUPROFILE=/tmp/0ad.prof 0ad
LD_PRELOAD pre-loads the profiler library, CPUPROFILE determines the location of the profiler output. 0ad is the name of the binary file to be executed. The path to the libprofiler library may vary depending on the distribution, the path could also be /usr/lib/libprofiler.so.0. When you are finished profiling, close 0ad.
At this point, /tmp/0ad.prof contains the CPU profile information. To display it graphically, run the following command and ensure that you use the absolute path to 0ad. On arch-based systems, use pprof rather than google-pprof.
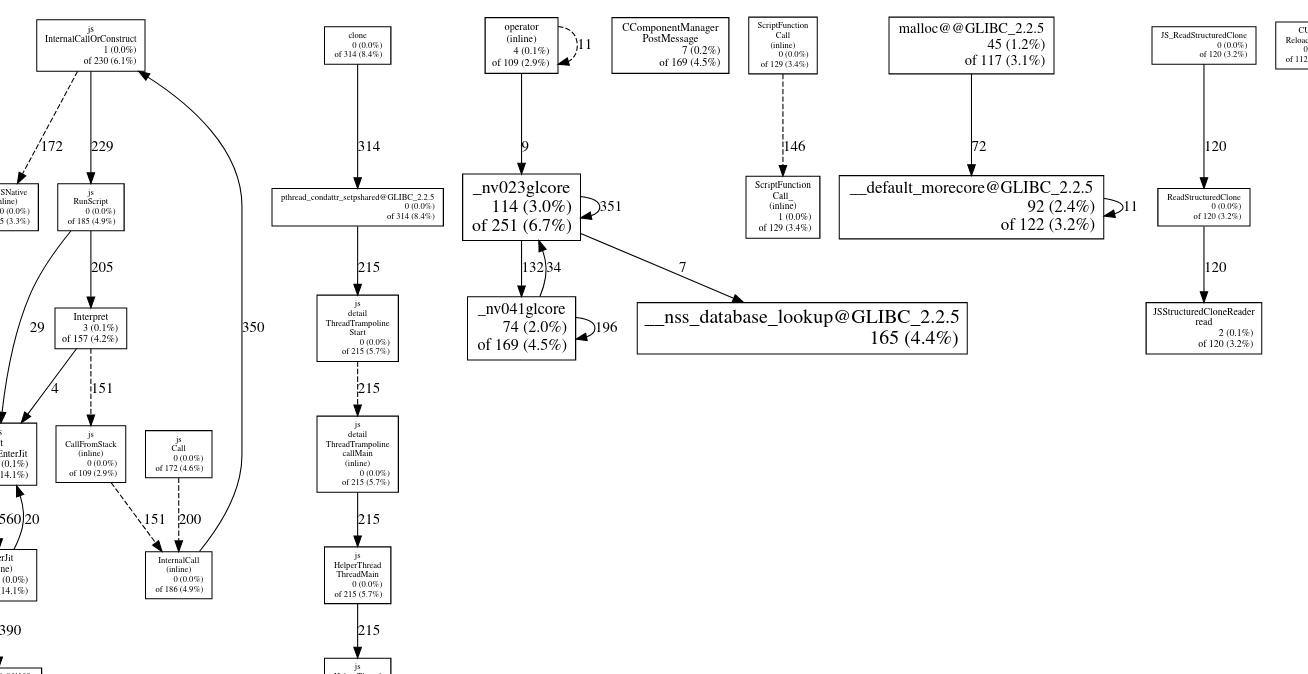
google-pprof --web /usr/bin/0ad /tmp/0ad.prof
After a couple of minutes, your default web browser opens and displays the graphical profile in a svg format.
It is going to look similar to this:
 output example")
Valgrind
Callgrind with KCacheGrind is quite nice for detailed (though not hugely accurate) profiling. Valgrind often doesn't like SpiderMonkey's JITs so you may have to use valgrind --smc-check=all ... if it otherwise crashes.
Very Sleepy
Win32 tool very fast and easy to use and setup download
Graphic performance tools
See GraphicsProfiling.
Attachments (4)
-
profile_24_1.gif
(80.2 KB
) - added by 11 years ago.
example profile graph
- tracelogger.png (177.1 KB ) - added by 9 years ago.
-
filter_data.diff
(722 bytes
) - added by 6 years ago.
"Changes to filter the output of extract.pl"
-
0ad_pprof_example.png
(113.8 KB
) - added by 21 months ago.
pprof (gperftools) output example
Download all attachments as: .zip