
| Version 13 (modified by , 11 years ago) ( diff ) |
|---|
Table of Contents
Introduction
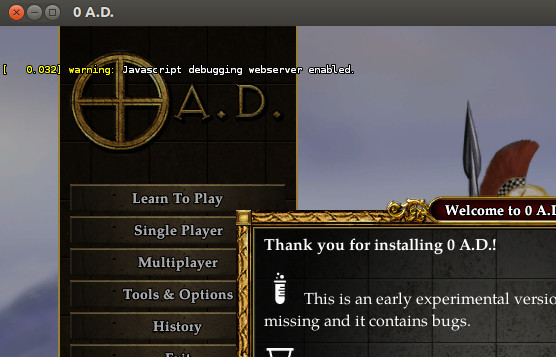
A large part of the game like components, GUI scripts or the AI are written in Javascript. If you have programmed C++ or used Javascript for websites you probably know how important a good debugger can be and how much it helps to find bugs or learn how a part of code works. The web based Tools like Firebug can't be used for 0 A.D. because the debugger has to be very closely connected to the Javascript runtime. However, there's a dedicated tool for 0 A.D. and the Pyrogenesis engine being developed at the moment that should hopefully be ready to use soon.
Technical background
The DebuggingServer component makes debugging commands like (ToggleBreakpoint, Step, Continue etc...) available using a Mongoose webserver. The format used for return values is JSON, which should be easy to parse from a web-GUI. The Debugger uses the JSDBGAPI provided by Spidermonkey 1.8.5. Newer versions of Spidermonkey provide a simplified new API (along with memory leak fixes, performance improvements and more), but unfortunately Mozilla isn't interested in doing the work and publishing a independent build from Firefox at the moment. We had a discussion about that on IRC. We're thinking about upgrading Spidermonkey nevertheless, but that could be a bigger task.
The JSDBGAPI isn't thread-safe and also our current implementation of ScriptInterfaces (which are basically abstractions of Spidermonkey) isn't thread-safe either. As a general rule, all Javascript objects are tied to one ScriptInterface which represents one Javascript runtime and one Javascript context and can only be used in one thread (although multiple ScriptInterface can be used in one thread). We do use multiple threads, but they don't share ScriptInterfaces. One major difficulty about implementing a debugger is not to violate these constraints.
The idea is that there's one CThreadDebugger class which is responsible for tracking hooks, callbacks, breakpoints and general state information for each of those ScriptInterfaces. The class CDebuggingServer manages multiple ScriptInterfaces (which are potentially multiple threads) using multiple objects of CThreadDebugger. It passes commands from the Mongoose webserver (triggered by the user) to the CThreadDebugger objects and retrieves state information from these objects and returns it to the user as JSON. The DebuggingServer makes sure not to access any Spidermonkey functions or Javascript objects directly (because they belong to the ScriptInterface's thread). The DebuggingServer itself should also be thread-safe to accept multiple request asynchronously.
Available commands
This section lists all currently implemented commands and gives some examples of data they return.
Setting: Simultaneously breaking threads
This setting specifies the behaviour when a breakpoint is hit. If enabled, all other threads executing Javascript code will halt too as soon as possible and their status (ThreadInBreak) will change to true. Keep in mind that other ScriptInterfaces being executed in the same thread will not halt because their code will only be reached when you continue the execution in the current ScriptInterface. Another limitation is that threads can only be halted by this debugger when they execute Javascript code! You can set breakpoints with your favourite c++ debugger at the right places if you need seamless debugging between c++ and Javascript.
Get
http://127.0.0.1:9000/GetSettingSimultaneousThreadBreak
Returns:
{ "Enabled" : true }
Set
http://127.0.0.1:9000/SetSettingSimultaneousThreadBreak?Enabled=false
Arguments:
- Enabled: If the setting should be enabled (true or false).
Returns: Nothing
Toggling (setting/removing) breakpoints:
http://127.0.0.1:9000/ToggleBreakpoint?filename=gui/gamesetup/gamesetup.js&line=1502
Returns: Nothing
Get the status of all threads
http://127.0.0.1:9000/GetThreadDebuggerStatus
Returns:
[ { "ThreadDebuggerID" : 1,"ScriptInterfaceName" : "GUI","ThreadInBreak" : true,"BreakFileName" : "gui/gamesetup/gamesetup.js","BreakLine" : 1502 } ]
Note: BreakFileName and BreakLine should be considered "undefined" if ThreadInBreak is false!
Continue
Continue the execution until the next breakpoint is hit.
http://127.0.0.1:9000/Continue?threadDebuggerID=1
Arguments:
- threadDebuggerID: The ThreadDebuggerID of the thread that should be continued. You can get this ID by calling GetThreadDebuggerStatus. If you pass 0, all threads will be continued.
Returns: Nothing
Note: The command has no effect if the thread is not stopped.
Step
Steps to the next line of code and will step over functions that are called on the current line.
http://127.0.0.1:9000/Step?threadDebuggerID=1
Arguments:
- threadDebuggerID: The ThreadDebuggerID of the thread that should be stepped. You can get this ID by calling GetThreadDebuggerStatus.
Returns: Nothing
Step into
Steps into function calls on the current line of code or steps to the next line if there aren't any function calls.
http://127.0.0.1:9000/StepInto?threadDebuggerID=1
Arguments:
- threadDebuggerID: The ThreadDebuggerID of the thread that should be stepped. You can get this ID by calling GetThreadDebuggerStatus.
Returns: Nothing
Step out
Steps out of the current function and stops the execution in the parent function.
http://127.0.0.1:9000/StepOut?threadDebuggerID=1
Arguments:
- threadDebuggerID: The ThreadDebuggerID of the thread that should be stepped. You can get this ID by calling GetThreadDebuggerStatus.
Returns: Nothing
Getting Callstacks
Returns the callstacks of all threads that are in break mode.
http://127.0.0.1:9000/GetAllCallstacks
Returns:
{ "CallStacks" : [{"ThreadDebuggerID" : 1, "CallStack" : ["keywordTestOR","annonymous","testFilter","initMapNameList","selectMapType","__eventhandler31 (selectionchange)","initMain","onTick","__eventhandler28 (tick)"]}] }
keywordTestOR is the innermost function which got called by an annonymous function, which got called by "testFilter" etc... You also get the ThreadDebuggerID to know which thread is meant.
Getting a stack frame
Returns all variables and their content of the specified thread and nesting level.
http://127.0.0.1:9000/GetStackFrame?nestingLevel=0&threadDebuggerID=1
Returns:
... need to find a shorter example ...
Arguments:
- nestingLevel If you look at the function above (GetCallstack), nestingLevel=0 would point to the innermost stackframe (keywordTestOR). Native functions as "eventhandler31" don't return any data.
- threadDebuggerID The thread you want to get the a stack frame from.
Getting a list of .js files
Returns all full Vfs paths ending with *.js loaded into the Vfs.
http://127.0.0.1:9000/EnumVfsJSFiles
Returns (shortened)
["globalscripts/Math.js","globalscripts/Technologies.js","hwdetect/hwdetect.js","hwdetect/test.js","gui/aiconfig/aiconfig.js","gui/civinfo/civinfo.js"]
Getting a file
Returns a whole file without any formatting (no JSON).
http://127.0.0.1:9000/GetFile?filename=globalscripts/Math.js
Returns: A file as plaintext.
Arguments:
- filename A full Vfs path to a file
Known issues
- Error messages can be displayed caused by StringifyJSON and objects that don't support serialization
- Getting a stack frame and getting the callstack doesn't always work. This will have to be checked more closely soon.
- Some functionality is still missing. Further testing, proper error handling and correcting/completing comments is also required.
Attachments (5)
- enabled_warning.jpg (56.1 KB ) - added by 11 years ago.
- after_startup.gif (95.5 KB ) - added by 11 years ago.
- file_filter.gif (5.3 KB ) - added by 11 years ago.
- debugging_alpine_lakes.gif (79.8 KB ) - added by 11 years ago.
- callstack_and_values.gif (20.1 KB ) - added by 11 years ago.
Download all attachments as: .zip