
| Version 18 (modified by , 11 years ago) ( diff ) |
|---|
Table of Contents
Introduction
A large part of the game like components, GUI scripts or the AI are written in Javascript. If you have programmed C++ or used Javascript for websites you probably know how important a good debugger can be and how much it helps to find bugs or learn how a part of code works. Existing tools like Firebug can't be used for 0 A.D. because the debugger has to be very closely connected to the Javascript runtime. However, there's a dedicated debugging tool for 0 A.D. and the Pyrogenesis engine which is not as sophisticated as Firebug but offers some basic debugging functionality. This article describes the usage of the Pyrogenesis script debugger. If you are interested in technical documentation of the debugger and in changing the debugger itself, please refer to Javascript debugging server.
Overview
The debugger requires two components to work. First, there's a webserver built into the engine and second, there's a web GUI that can be launched from anywhere by opening a html file in a web browser. All important commands can be executed from the web GUI and it displays script code and information like active breakpoints or running threads.
Enabling the debugger
The debugger can run both in release and in debug builds. However, the debugging server is disabled by default for performance and security reasons. You can enable it by adding this line to your local.cfg.
jsdebugger.enable = true ; Enable Javascript debugging (default off for security/performance)
If you only need the debugger for a single session, you can use a command line argument:
./pyrogenesis -conf=jsdebugger.enable:true
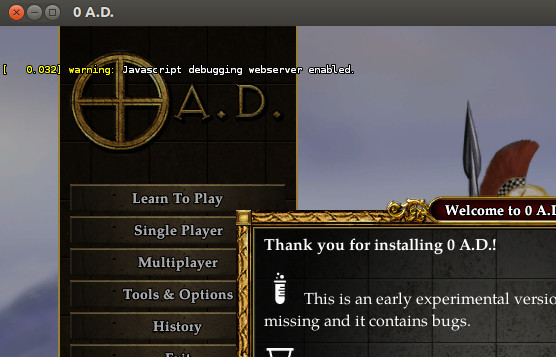
A yellow warning message is displayed in the game if the debugger is enabled.

Using the debugger
Starting
First start the game and make sure that the debugger is enabled. Then open 0ad/source/tools/jsdebugger/index.html in a web browser.

The debugger will load a list of script files loaded by the engine (1). Because no file is loaded at the moment, the file panel in the middle (2) will be empty. On the right side (3) you see all (or most) commands that are available. On the bottom left side (4) there's a list of currently running script interface instances. They can all be different threads, but that's not necessarily so. Because the scripts are running and we haven't triggered a breakpoint yet, the callstack window (5) is empty. The values window (6) contains the three root nodes for values you can watch (locals, this, global) but they are empty at the moment.
The following sections describe all these panels in more detail.
Files (1)
This is a list of all .js files currently loaded into the vfs by the engine. You can type something in the search field and it will only display those files that match the pattern. Double-clicking a file will open it in the file panel in the middle.

File panel (2)
The file panel displays a file with line numbers, syntax highlighting and even some basic syntax validations. However, it only displays the file and you can't edit it there directly. You see breakpoints and can toggle breakpoints by klicking left beside the line numbers. The yellow line shows you at which line the execution is currently halted.

Attachments (5)
- enabled_warning.jpg (56.1 KB ) - added by 11 years ago.
- after_startup.gif (95.5 KB ) - added by 11 years ago.
- file_filter.gif (5.3 KB ) - added by 11 years ago.
- debugging_alpine_lakes.gif (79.8 KB ) - added by 11 years ago.
- callstack_and_values.gif (20.1 KB ) - added by 11 years ago.
Download all attachments as: .zip